Goal: maximum number of leads priced at $5 or less
Niche: B2C sale of car accessories
Region: Ukraine
Budget: unlimited
Promotion channels: Google Ads + Facebook & Instagram
Advertising period: April 2020 – May 2021
Launch of advertising
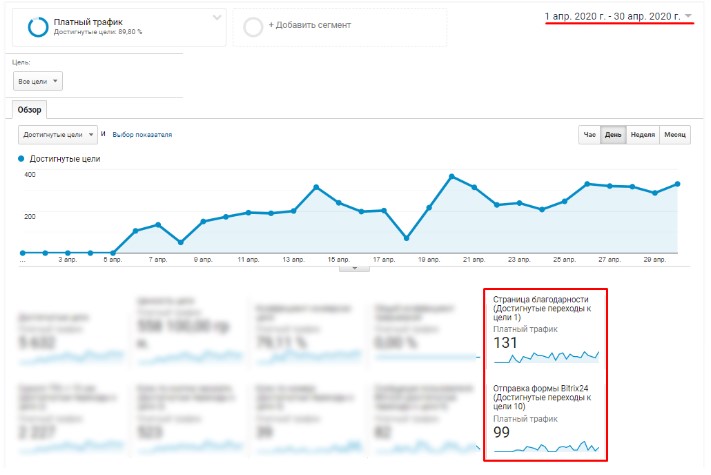
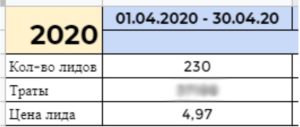
The first to launch advertising on Facebook and Instagram to a wide audience + retargeting. In April, we received 230 leads at a price of $4.97.
Screenshot 1: Data from Google Analytics for 01.04.20 – 30.04.20
Screenshot 2: Data from the pivot table for 01.04.20 – 30.04.20
The client was satisfied with the results, but he was interested in scaling up as quickly as possible, and the next month’s plan was already 400 leads at the same price.
It was decided to launch contextual advertising in Google Ads. Initially, these are manual assignment of bets, exact keys, and keys with a modifier. The priority was to work with CPC. It was important that only the most effective keywords had a high bid.
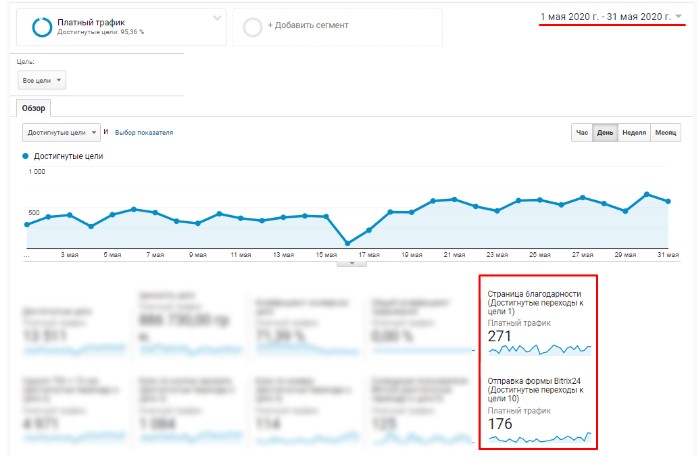
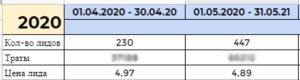
In May, we received 447 leads (95% more than in April) at a price of $4.89. These volumes fully met the client’s needs at the time.
The next task was to maintain the monthly volume and reduce the cost of a lead to $4.5 per application.
Screenshot 3: Data from Google Analytics for 05/01/20 – 05/31/20
Screenshot 4: Data from the summary table for 01.04.20 – 31.05.20
Optimization and difficulties
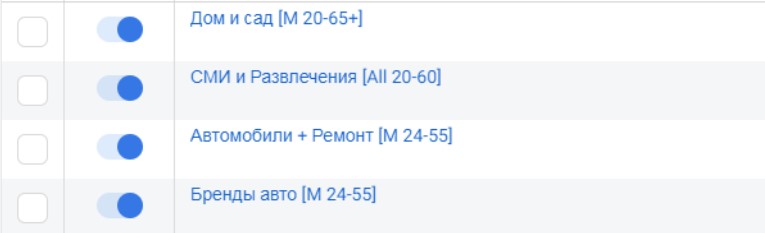
For optimization, we analyzed Facebook campaigns and decided to segment broad targeting into small and narrowly focused interests to identify more promising and less promising areas.
The first targets were tested:
Automotive theme;
Home and garden;
Media and entertainment.
Screenshot 5: ad groups and targeting in Facebook Ads
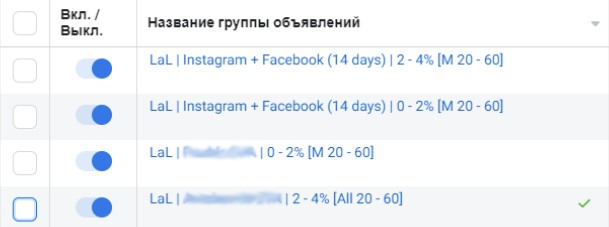
In addition, during the entire period of advertising, quite large look-a-like audiences have already gathered, which we distributed in this way:
Everyone who bought 1-2%;
Everyone who bought 2-4%;
Engaged social media users 2%;
Engaged social media users 2-4%.
Screenshot 6: targeting Look-a-like at Facebook Ads
All look-a-like audiences were mixed with the constituent audiences and partially with each other.
Another bonus to the effectiveness of look-a-like audiences was that the client agreed to SMM promotion, and due to the increase in engagement, the audiences had a large reach of target users.
In Google Ads, we expanded the semantics for a wider range of keys: we tested general keys and keys without a modifier.
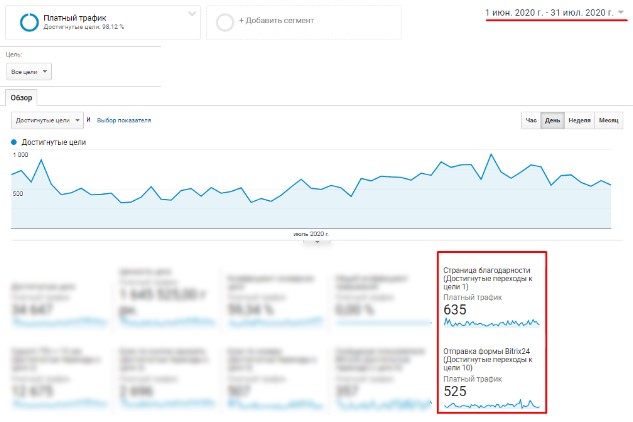
Despite the fact that not all of the hypotheses worked out, we managed to exceed the plan in terms of the number of leads and price.
Screenshot 7: Data from Google Analytics for 06/01/20 – 07/31/20
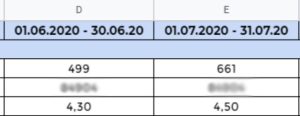
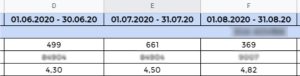
Screenshot 8: Data from the summary table for 01.06.20 – 31.07.20
1,160 leads in two months (74% more than in April-May) with an average price of $4.3-4.5. It could have been a success, but there was a problem with the discrepancy between the leads in the client’s CRM and our Google Analytics.
At the beginning of August, we conducted an analysis of the lists of requests in CRM and the time they entered Google Analytics and found that some conversions were registered at approximately the same time. After several test applications, we realized what the reason was – Some users refreshed the “Thank you” page several times after landing on it, and this caused a discrepancy between Google Analytics and the client’s CRM.
Roughly speaking, about every 10 users who left a request refreshed the page, which counted an extra conversion in Google Analytics, but did not send the form to the client’s CRM. He didn’t notice anything suspicious, so the discrepancy was discovered only at the end of the month, when the lead report was available.
The site was written in a “self-written” format, so it was difficult to change anything in it. It was decided to make a new website with a new design and a developer to support it.
The website was launched on August 18.
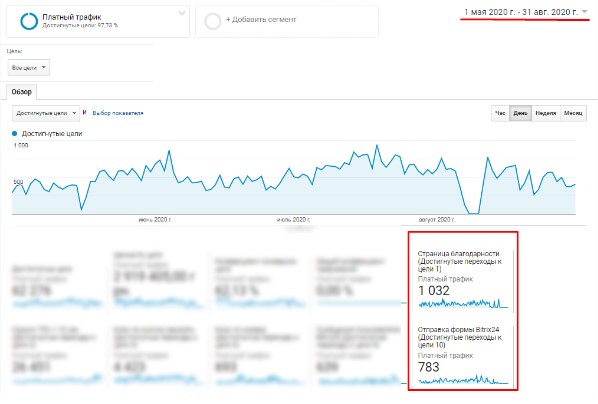
All three months of the summer were closed with results: 1529 applications with an average price of $4.54
For the new site, a new submission to Google Analytics was created, and then it became the main submission.
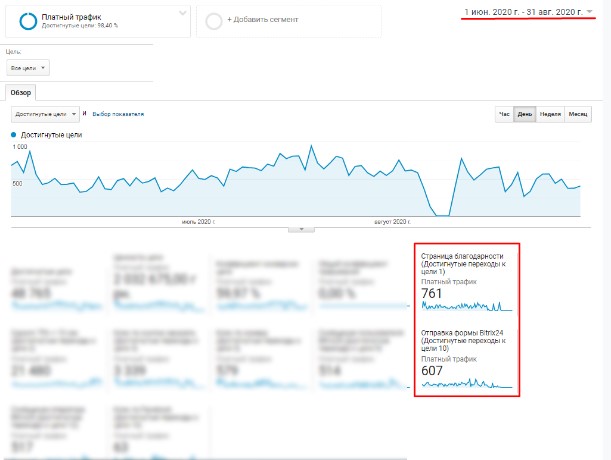
Screenshot 9: Data from Google Analytics for 01.06.20 – 31.08.20 (old view)
Screenshot 10: Data from Google Analytics for 08/01/20 – 08/31/20 (new presentation)
Screenshot 11: Data from the summary table for 01.06.20 – 31.08.20
New website. Seasonality. Scaling.
The new website brought a breath of fresh air and stood out with its new bright design.
By this point, our goal was to prepare for the season and scale up as much as possible.
At that time, many new competitors entered the market.
The challenge was to scale and keep the price per lead at $4.5.
Changes in Facebook:
It was decided to divide the campaigns into Kyiv and all other regions of Ukraine. Since Kyiv alone generated more than a third of all orders from Facebook, we decided to optimize for it.
We continued to develop look-a-like and retargeting systems, test new targets, test hypotheses, and experiment. This way, we could have up to 20 targeting options running at the same time, which allowed us to get the widest possible coverage and not burn out for a long time.
New ways of communicating with customers were tested, for example, videos with customer reviews or thematic information posts.
Changes at Google:
The biggest and most significant change was the optimization of campaigns based on CPA strategies, which, although not immediately, began to bring stable results at the right price.
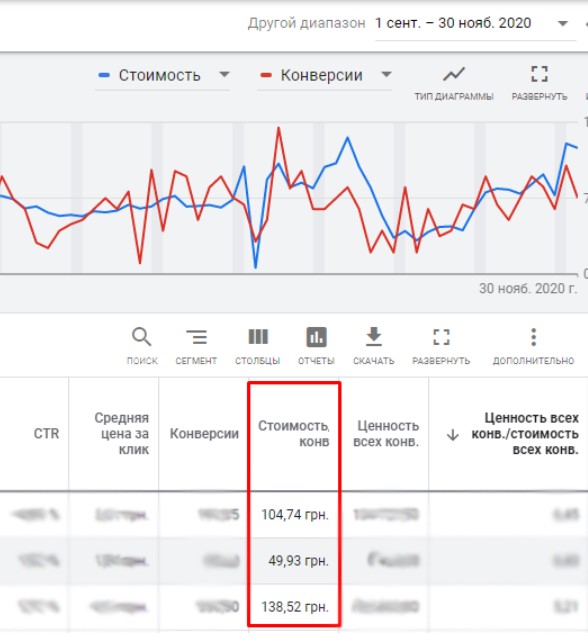
Screenshot 12: Cost of conversions in CPA campaigns on Google Ads
In general, Google Ads was cheaper than Facebook, but slightly lower in terms of volume. In order to increase them, it was decided to launch PPC campaigns and subsequently switch them to CPA, which made it possible to catch up with Facebook in terms of volume without much of a drop in lead price.
The following formats were tested for the CCM:
Targeting by interests and intentions;
Wide audience without targeting;
Special audiences for competitors’ websites;
Google’s smart media campaign;
Media remarketing.
Despite the fact that we had to do a lot of cleaning of low-quality websites, apps, and YouTube channels, the PPC campaigns increased the number of direct and associative conversions and influenced brand awareness.
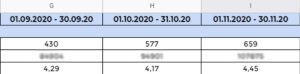
We managed to close the entire fall period with 1666 leads (9% more than in the summer) at a price of $4.3.
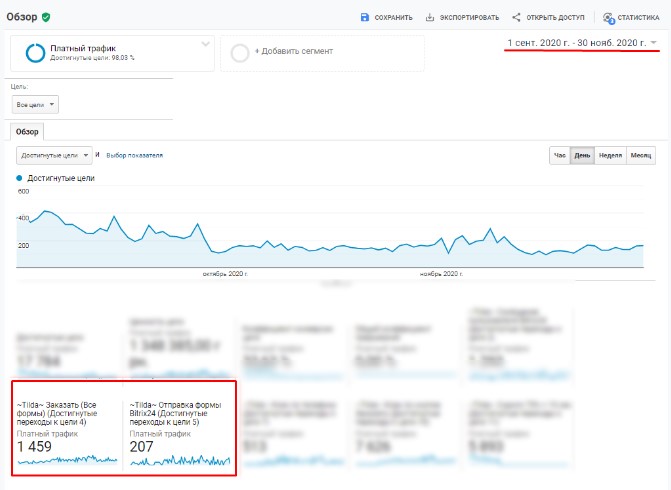
Screenshot 13: Data from Google Analytics for 09/01/20 – 11/31/20
Screenshot 14: Data from the summary table for 09/01/20 – 11/31/20
New Year and post-New Year period
On December 1, problems began to arise. We knew that auctions can overheat in the New Year, but December 20 seemed to us to be anomalous even for the New Year holidays. In the first week, the price of ice went up and competition in the market increased dramatically.
Perhaps this was due to the emergence of a large number of seasonal players.
We contacted the client as soon as possible and discussed the situation. It was decided to sacrifice volume to keep the lead price at $5.
On Facebook, we abandoned most of the tests and left only a few of the most effective targets, retargeting, and look-a-likes.
Google has completely abandoned CPA (except for remarketing) and reduced daily budgets and target price per conversion in CPA campaigns by about 20%.
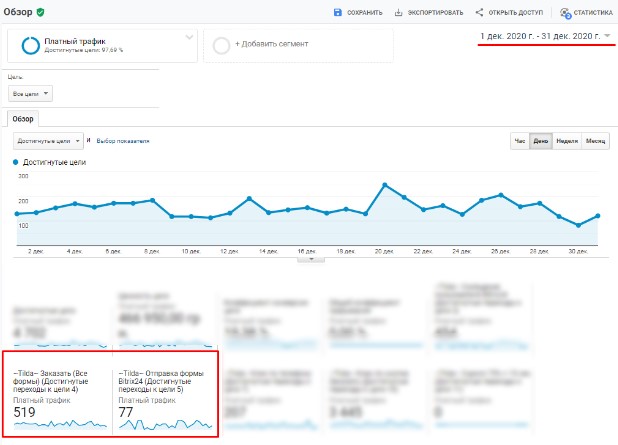
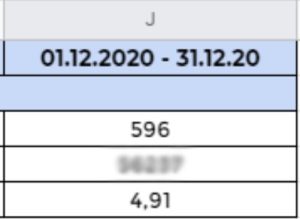
We managed to get 596 leads at a price of $4.91, which fully satisfied the client’s needs.
Screenshot 15: Data from Google Analytics for 12/01/20 – 12/31/20
Screenshot 16: Data from the summary table for 12/01/20 – 12/31/20
January and February were, as expected, “dead” months, and advertising was running at minimal volumes.
March, April, May and summarizing the results
We started to restore volumes in March-April of ’21 and, unfortunately, we did not do it without difficulties. The first problem was that the old Facebook targets were no longer relevant, and we had to find and train new ones. There was also an IOS14 update and account blocking. But we managed to overcome all these difficulties and prepare for the summer season.
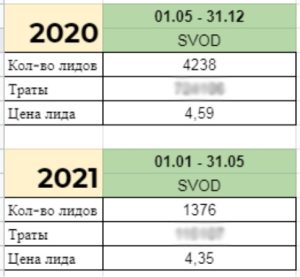
For 1 year from 01.05.20 to 31.05.21 (we count from May, because April 20 was a test month), we managed to attract 5,614 applications to the site, with an average price of $4.47, which was a success and fully satisfied the client’s requests.
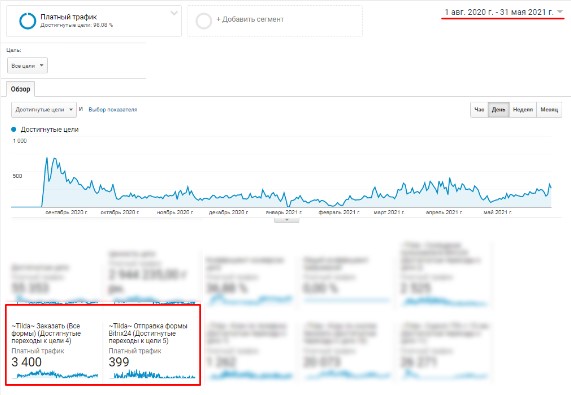
Screenshot 17: Data from Google Analytics for 05/01/20 – 08/31/20 (old version)
Screenshot 18: Data from Google Analytics for 08/01/20 – 05/31/21 (new submission)
Screenshot 19: Data from the summary table for 01.05.20 – 31.05.21
Currently, the cooperation is ongoing and we are preparing for the new summer season, which promises to be even more successful.